Statistics
Decisions have been announced. In what may be a new record for CVPR, announcements of papers were on their way being emailed within an hour of the close of the AC meeting. (Just enough time for the PCs to do a few sanity checks to make sure nothing was missing). The PC Chairs and ACs did a phenomenal job in processing this 1600+ papers in a fair and efficient manner. The reviewers did a great job before the meeting. Thanks to all!
At the end of the AC meeting, there were 59 papers (3.5%) accepted for orals and 379 (22.5%)accepted as posters, for an overall acceptance rate of 26.4% where Percentages are computed using the 1677 papers that entered the review process. In addition to the acceptances, there were 1052 formal rejections via the AC decisions, while 187 papers were rejected for administrative reasons e.g. dual submissions) or were withdrawn by the authors after reviewing. (These 1677 papers are in addition to the 353 "submissions" deleted by the administrator or by authors before reviewing began, taking the total CVPR paper entries to 2020.)
For those interested, here are some statistics below. As the General Chair, who was also involved running an AC panel, Terry would point out that none of the statistics below were computed or considered during the process. The PCs worked very hard to ensure a fair and unbiased process so we did not look at stats like these until it was all over. There were no quotas or limits implied or imposed for oral and/or posters. Here is a quick summary of the process. The AC panels of 10 or more experts were told to use their best judgment on what was of sufficient quality to accept. if they said accept, it was accepted. If the group said oral, it was oral. Most papers with a wide spread were discussed with the reviewers (2029 total discussions!) then by multiple ACs before an accept/reject decision was reached. Discussions after rebuttal are not visible to authors but important in decision making, often resolving discrepancies between reviews. If you see comments about reviewers changing their "scores", that is almost always why, they read/discuss it with the other reviewers. To anyone that might feel there was a bias against an area or person, the committees were running in parallel and did not have information on totals let alone subtotals. We were all too busy making sure all papers were handled and double checking decisions matched the consensus reports to worry about subareas or stats. The reviewing was blind, the AC discussions and decisions were blind and then reviewed to make sure the process was followed.
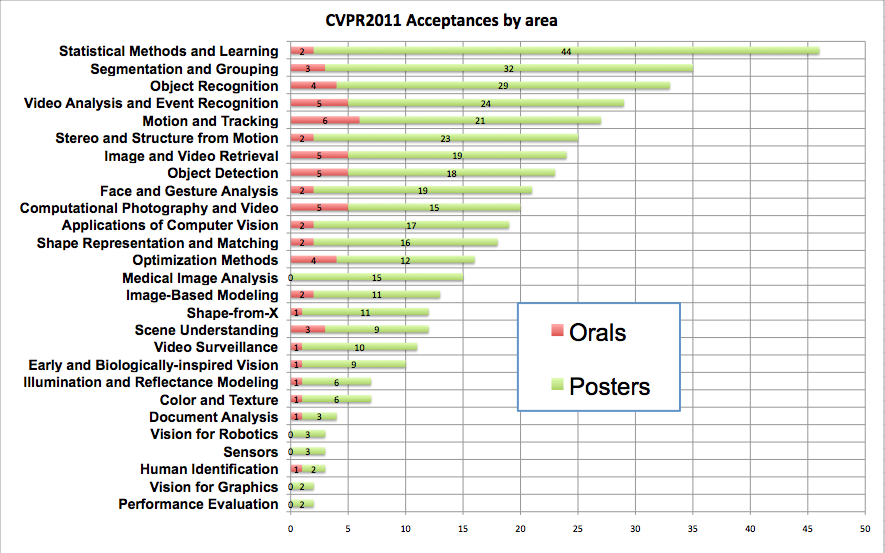
The following table shows additional stats showing the per-area acceptance rate and also the percentage of submissions/orals and posters for that area compared to the overall CVPR2011 pool.
| Primary Subject Area | Area Acceptance Rate | % of all CVPR11 Submissions | % of all CVPR11 orals | % of all CVPR11 Posters |
| Vision for Robotics | 16% | 1.13% | 0.00% | 0.79% |
| Human Identification | 17% | 1.07% | 1.69% | 0.52% |
| Face and Gesture Analysis | 21% | 5.84% | 3.39% | 4.99% |
| Performance Evaluation | 22% | 0.54% | 0.00% | 0.52% |
| Applications of Computer Vision | 23% | 5.01% | 3.39% | 4.46% |
| Motion and Tracking | 23% | 7.10% | 10.17% | 5.51% |
| Sensors | 23% | 0.78% | 0.00% | 0.79% |
| Early and Biologically-inspired Vision | 24% | 2.44% | 1.69% | 2.36% |
| Object Detection | 25% | 5.49% | 8.47% | 4.72% |
| Scene Understanding | 26% | 2.80% | 5.08% | 2.36% |
| Medical Image Analysis | 26% | 3.40% | 0.00% | 3.94% |
| Shape Representation and Matching | 28% | 3.82% | 3.39% | 4.20% |
| Vision for Graphics | 29% | 0.42% | 0.00% | 0.52% |
| Image and Video Retrieval | 29% | 4.95% | 8.47% | 4.99% |
| Color and Texture | 29% | 1.43% | 1.69% | 1.57% |
| Stereo and Structure from Motion | 30% | 4.89% | 3.39% | 6.04% |
| Video Surveillance | 31% | 2.15% | 1.69% | 2.62% |
| Segmentation and Grouping | 31% | 6.74% | 5.08% | 8.40% |
| Shape-from-X | 32% | 2.21% | 1.69% | 2.89% |
| Document Analysis | 33% | 0.72% | 1.69% | 0.79% |
| Illumination and Reflectance Modeling | 33% | 1.25% | 1.69% | 1.57% |
| Computational Photography and Video | 34% | 3.46% | 8.47% | 3.94% |
| Object Recognition | 35% | 5.66% | 6.78% | 7.61% |
| Statistical Methods and Learning | 35% | 7.87% | 3.39% | 11.55% |
| Video Analysis and Event Recognition | 35% | 4.89% | 8.47% | 6.30% |
| Optimization Methods | 36% | 2.62% | 6.78% | 3.15% |
| Image-Based Modeling | 38% | 2.03% | 3.39% | 2.89% |
| Withdrawn/Admin Rejects | 0% | 9.30% | 0.00% | 0.00% |